Formulating the allocation-based mixed model for the meatloaf tasting experiment
The sense in which the allocation is used is that it determines, via the tiers, the terms that will be included in the mixed model.
Brien and Bailey (2006, Section 4.1) give the two-phase sensory experiment in the following factor-allocation diagram that, because all allocation in this experiment was by randomization, is also a randomization diagram. The first phase was a production phase and the second phase the sensory phase. The design in the second phase consists of a pair of 6 x 6 Latin squares in each session.

An experimental design can be generated for this example and the anatomy table exhibiting its anatomy computed using the following R script; its output is here.
Formulating the model
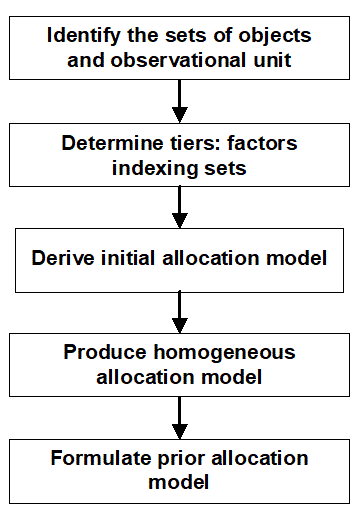
The following diagram illustrates the procedure for formulating the allocation-based mixed model. Derivation of the mode for the example follows the diagram or you can go to the derivation for a particular rectangle by clicking on it.

- Sets of objects and obervational unit The set of objects for this experiment are the treatments, the meatloaves and the tastings. Of these, the observational units are the tastings. It is the entity from which a single value of the response variable, a score, is obtained.
- Tiers The tiers for this experiment correspond to the factors that were (i) allocated in the production phase, (ii) the recipient factors in the production phase (and allocated in the sensory phase), and (iii) the recipient factors in the sensory phase. That is, there are 3 tiers as follows:
- Recipient sensory
- {Sessions, Panellists, Time-orders}
- Recipient production, allocated sensory
- {Blocks, Meatloaves}
- Allocated production
- {Rosemary, Irradiation}
Also, Meatloaves is nested within Blocks and both Panellists and Time-orders are nested within Sessions, because of the randomizations performed for the design.
Note that the tiers form disjoint sets of factors, the sets differing in their status in the allocation. Factors in different tiers have been associated by allocation, those within have not.
Now, if desired, the factor-allocation diagram for this example can be constructed. The first step in doing so is to place each of these 3 tiers in a panel, adding the nesting factors to those factors that are nested within others. Then the arrows, lines and symbols that detail the allocation would be added.
More explanation - Initial allocation model The symbolic form of the inital allocation model for this example, using first-letters for the factors, is:
R + I + R^I | B + B^M + S + S^P + S^T + S^P^T
Note that, because of the nesting of the factors, Meatloaves only occurs with Blocks and Panellists and Time-orders with Sessions.
More explanation - Homogeneous allocation model Perhaps Blocks and Sessions are to be changed from random to fixed, because of the small number (3) of them and the difficulty of estimating a canonical component in these circumstances. the interaction of the Panellists with the treatment terms is thought to be important. Modifying the initial allocation model to effect these changes produces the following homogeneous allocation model:
B + S + R + I + R^I + P + R^P + I^P + R^I^P | B + B^M + S + S^P + S^T + S^P^T
The three terms Rosemary^Panellists, Irradiation^Panellists and Rosemary^Irradiation^Panellists are intertier interactions.
More explanation - Prior allocation model It can be seen from the anatomy table for this example that Sessions and Blocks are confounded so that one will have to be omitted from the model for the mixed model to fit successfully. Thus, leaving out Blocks, the prior allocation model is:
S + R + I + R^I + P + R^P + I^P + R^I^P | B + B^M + S + S^P + S^T + S^P^T
More explanation


